
- Frontend
- AI
FinScope – financial analysis & journal auditing in the browser
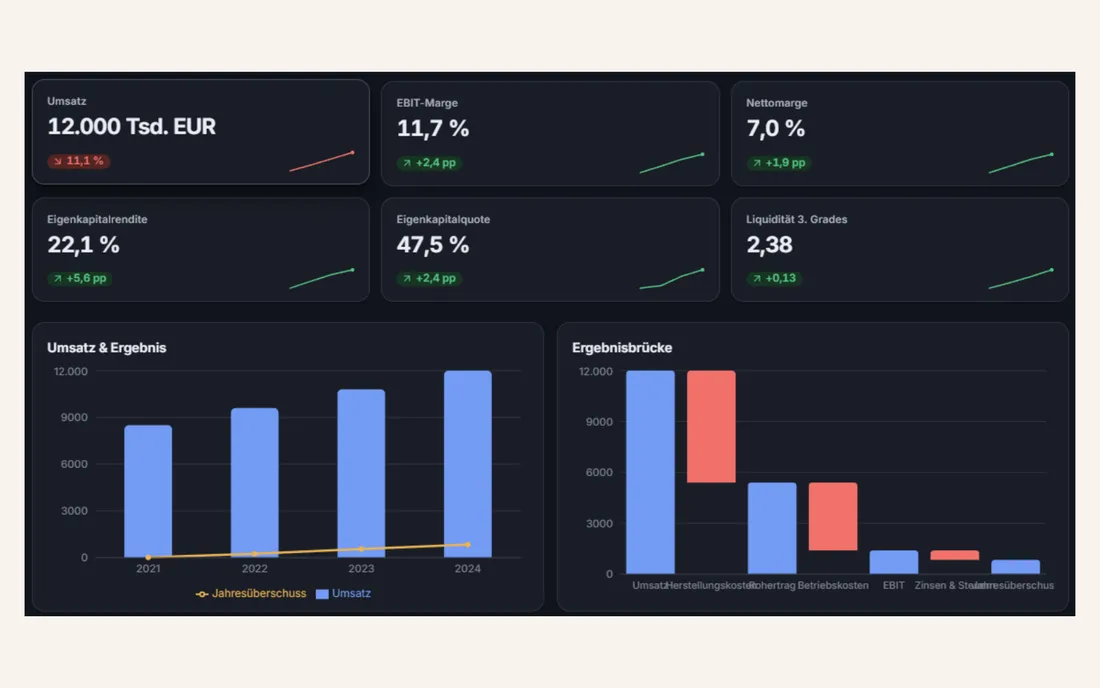
Image credit: Majd Edriss
Challenge
Financial data is hard to read for non-experts, and many analysis tools upload sensitive figures to third-party servers. The goal was an interface that turns statement and booking data into quick, readable insight, without the data ever leaving the device.
Result
A fully client-side web app with two modes: (1) Ratios – 19 financial ratios with traffic-light ratings, charts (revenue/earnings trend, income bridge, cost structure) and a grounded plain-language commentary; (2) Journal audit – a booking journal is screened for anomalies (Benford analysis, duplicates, outliers, threshold proximity, weekend postings). Bilingual, light/dark, 62 automated tests, live at finscope.me-dev.de.
Solution
At its core are two tested, deterministic engines with a fixed, verifiable data schema, each fronted by a flexible CSV column mapper. Everything is processed in the browser only, nothing is uploaded. Commentary and flags describe computed values only, nothing invented. Built with React and TypeScript, a custom OKLCH design system, tabular numerals and lazy-loaded charts (Recharts).
Technologies
- React
- TypeScript
- Vite
- Recharts
- Vitest
- OKLCH Design-Tokens
- Claude Code